What Google Gemini can do for infographics
Google Gemini is primarily known as an AI assistant — but since late 2024, it has also become a serious image generator. At its core is a model with Google's internal codename «Nano Banana Pro», with which Google solved the biggest problem of previous AI image generators: text in generated images stays readable.
That sounds obvious, but it isn't. Midjourney, DALL-E, and Adobe Firefly regularly produce illegible letter soup whenever a text label is part of the image. For infographics — structured graphics combining data, text, and visual elements — this is a crucial difference. Gemini renders titles, labels, and short texts within infographics with significantly higher reliability than its competitors.
There is also a second advantage: Grounding. Gemini can access real-time data from the web when creating an infographic — instead of hallucinating facts. This makes a real difference whenever market data, statistics, or current comparison values need to be part of the graphic.
«Nano Banana Pro» is Google's internal codename for the current image generation model in Gemini. Access: gemini.google.com → Tools → «Create images» → Model: «Thinking». A free Google account is all you need to get started — no separate subscription required.
Why infographics make sense for SME communication
65% of people absorb information visually faster than through body text. That explains why infographics systematically generate more engagement on LinkedIn than pure text posts — and why presentations with clear visualizations are more persuasive than tables. For SMEs offering complex services or wanting to reach decision-makers, infographics are an underestimated communication tool.
Until recently, the barrier was high: professional infographics required design expertise, time, or a budget for external design work. With an AI tool like Google Gemini, this effort can be significantly reduced. Three typical SME scenarios where infographics can be deployed directly:
- LinkedIn post: Annual review or industry data as a visual statistics infographic instead of a text block
- Proposal presentation: Performance comparison or process visualization for clients — created once, used many times
- Internal training: Onboarding processes or quality standards visualized for new employees
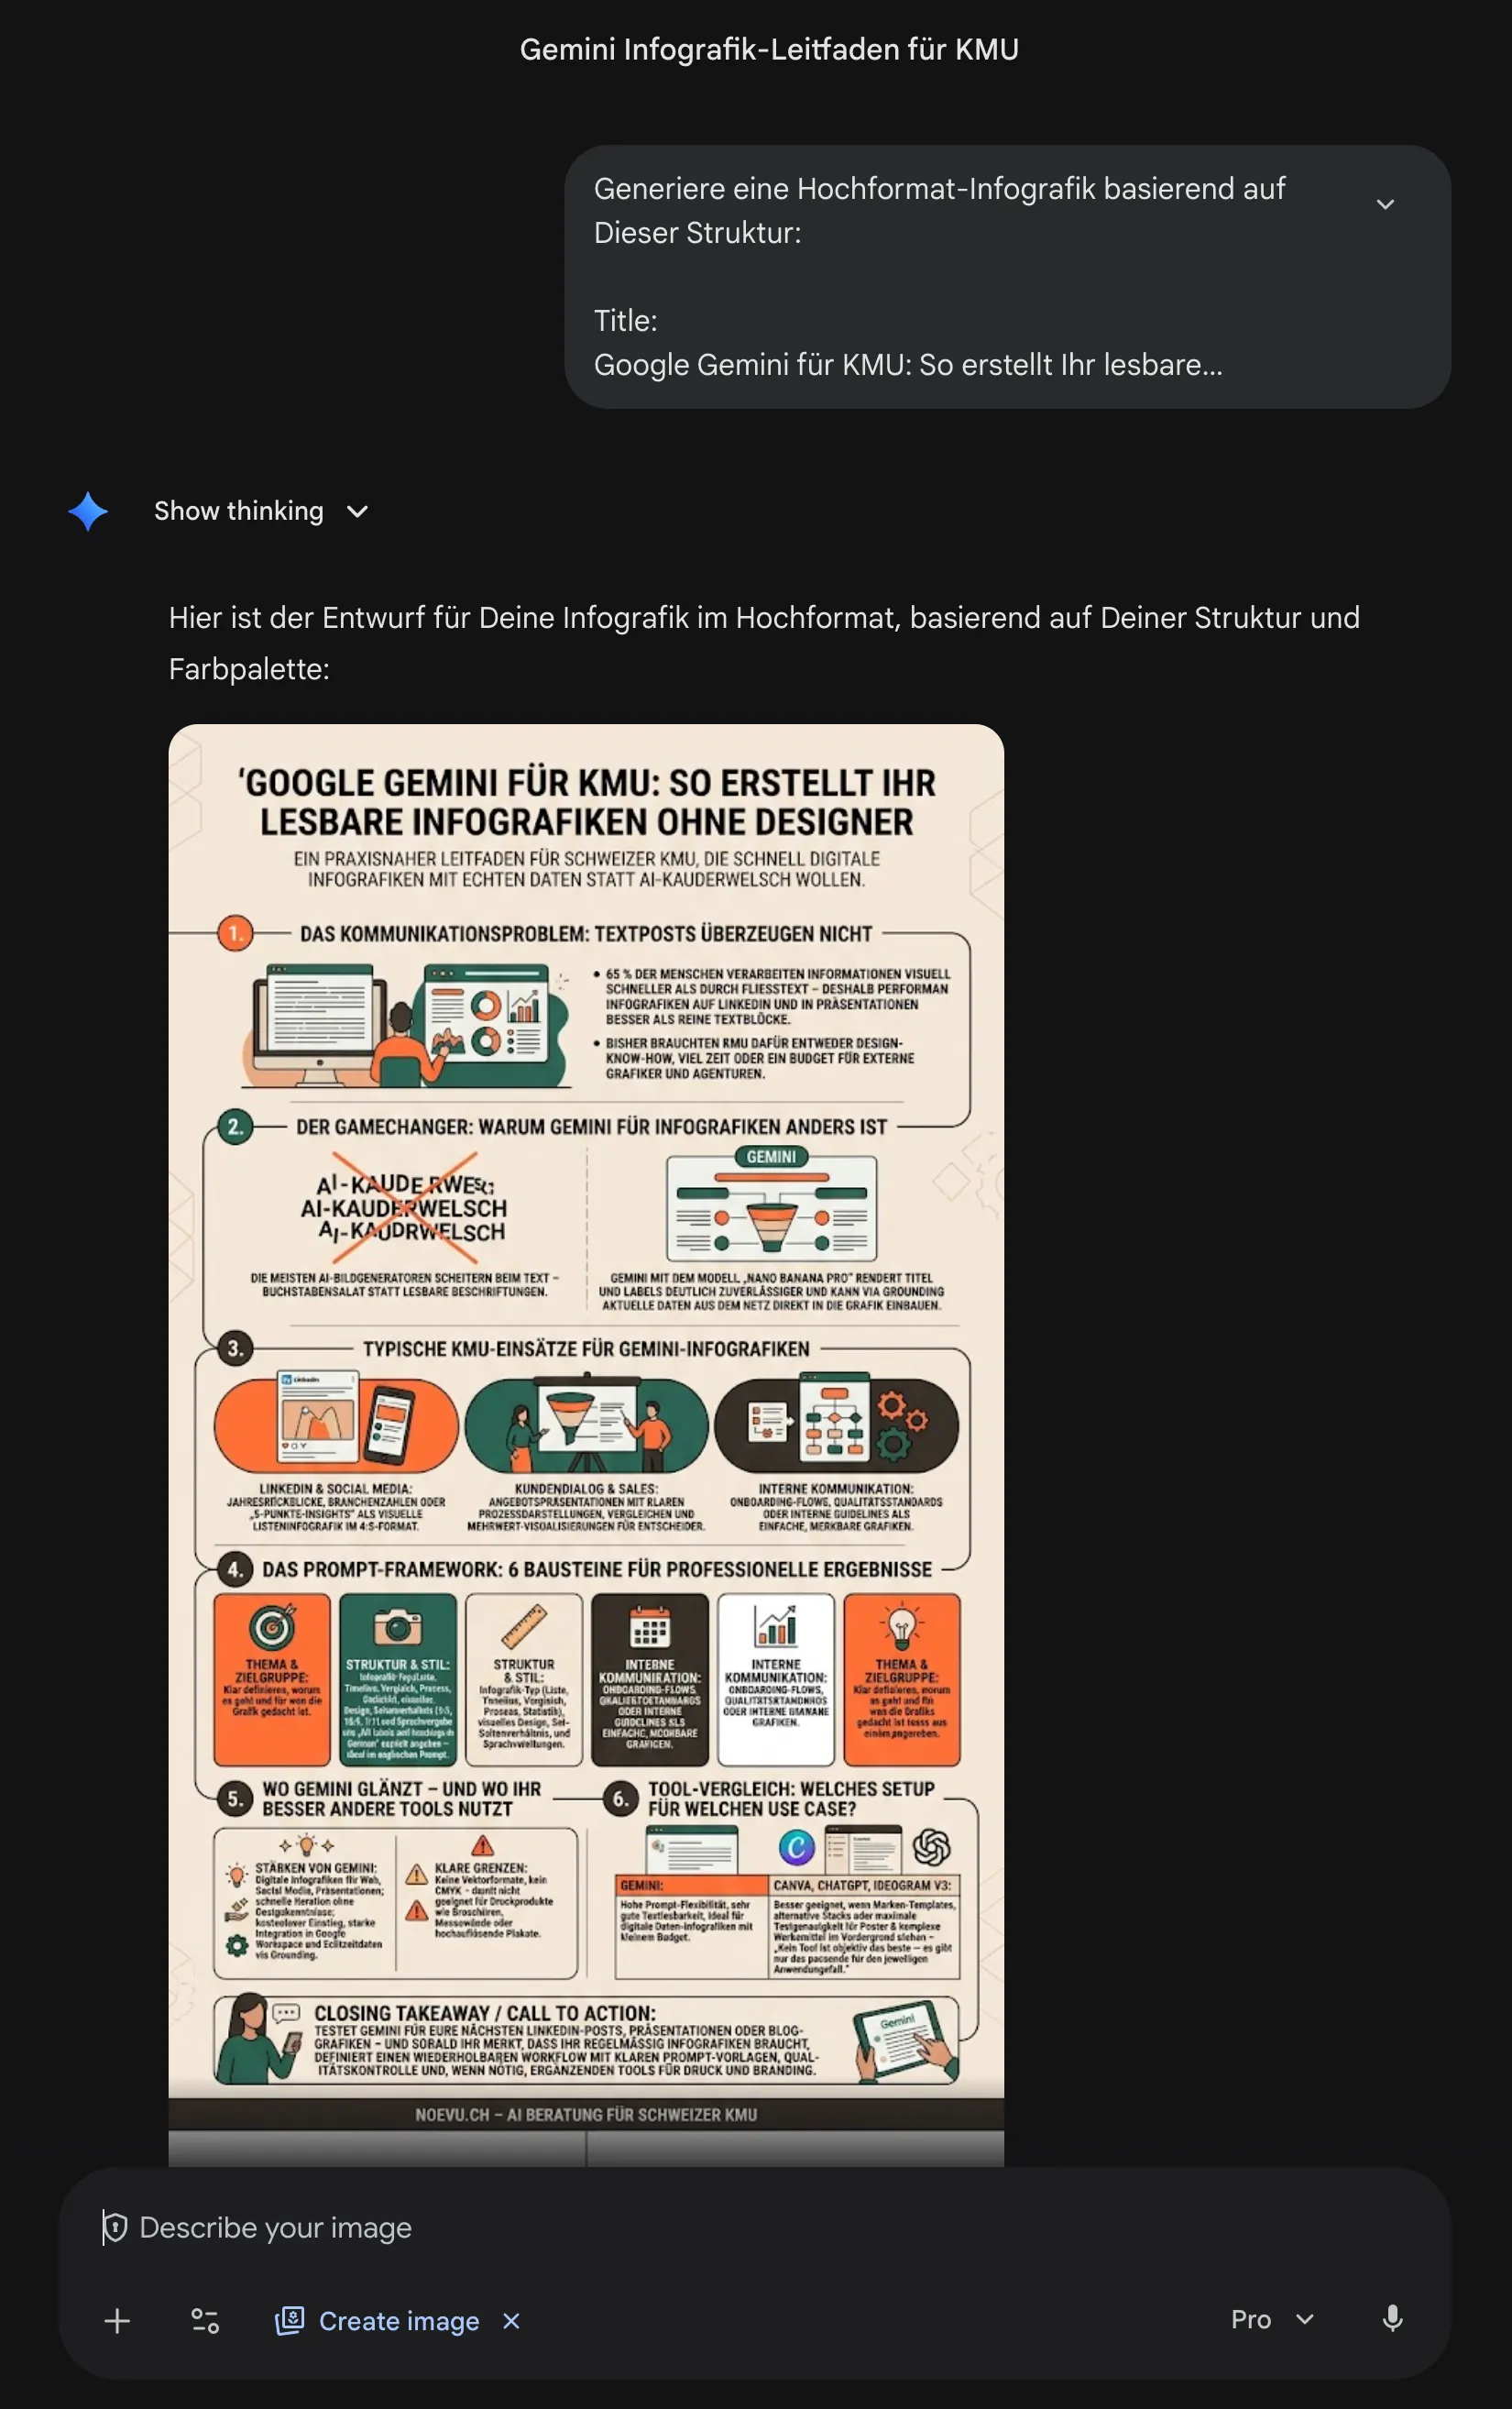
Step by step: Creating your first infographic
The entry point is simpler than expected. Anyone with a Google account can generate their first infographic today — no design skills and no additional software required.
1. Go to gemini.google.com
Open the page in your browser and sign in with your Google account. A free account is fully sufficient to get started.
2. Open the Tools menu
Click the «Tools» icon in the input field at the bottom and select «Create images» from the dropdown menu.
3. Set the model to «Thinking»
Select «Thinking» in the model selector at the top right — this activates the Nano Banana Pro model with improved text rendering.
4. Enter your prompt
Write your infographic prompt in the input field. Include topic, target audience, infographic type, and visual style. Write in English — even if the final text should appear in German or another language.
5. Iterate and export
Gemini generates several variants. Click on one to enlarge it and download it as a PNG. For adjustments, add to your prompt and generate again.
For current data in the infographic — such as market shares, statistics, or usage figures — web search can be activated in the same dialog. Gemini then verifies facts in real time and incorporates them directly into the graphic. This reduces the risk of including outdated or hallucinated numbers.
Prompt structure for professional results
The result depends directly on the quality of the prompt. Entering «Create an infographic about social media» produces something generic. Being more precise produces something usable. Six pieces of information make the difference between a generic and a professional result:
- Topic — What's it specifically about? (e.g. «5 benefits of headless CMS for mid-sized companies»)
- Target audience — For whom? (e.g. «Managing directors without a technical background»)
- Infographic type — What structure? (e.g. «list infographic», «timeline», «comparison infographic»)
- Visual style — What look? (e.g. «Minimalist, colors: dark blue and white, modern typography»)
- Aspect ratio — For which format? (e.g. «4:5 for Instagram», «16:9 for presentation», «1:1 for LinkedIn»)
- Language — In which language should text appear? (e.g. «All labels and headings in German»)

Write your prompt in English — even if the infographic should contain text in German. The model was trained primarily on English data and understands English instructions more precisely. Specify the desired German text as an explicit instruction: «All labels and headings in German.» This consistently produces better results than a fully German-written prompt.
Which infographic types Gemini handles well
Gemini is not an all-purpose graphics program — but for digital infographics it handles a broad range of formats. The following overview shows which types work well, where Gemini excels, and which output format they are best suited for.
| Gemini strength | Recommended format | |
|---|---|---|
| List infographic | Excellent | 4:5 (Instagram, LinkedIn) |
| Timeline | Good | 16:9 (presentation) |
| Comparison infographic | Good | 1:1 (social media) |
| Process visualization | Good | 16:9 or 4:5 |
| Statistics infographic | Medium | 4:5 or 1:1 |
'Excellent' = reliable in the first generation. 'Medium' = good results after 2–3 iterations.
When Gemini makes sense — and when it doesn't
Gemini is a useful tool for digital infographics — but not without limitations. Knowing the boundaries helps make the right decision for your use case and avoid unpleasant surprises. Gemini works well when:
- Infographics are needed for digital channels (LinkedIn, Instagram, presentations, blog posts, internal reports)
- There is no large design budget and rapid iteration matters more than pixel-precise control
- Google Workspace is already in use — Gemini integrates seamlessly with existing Google tools
- Real-time data via grounding should be embedded (e.g. current market data or statistics)
Those looking for a consultation on automated image workflows will find a different approach here: scalable infographic production as a repeatable process — not as one-off generation.
Gemini is not suitable for print products. Generated images are available exclusively as PNG or JPEG — no vector format (SVG, EPS, PDF), no CMYK color profile. For brochures, trade show materials, or high-resolution print products, professional design software or an agency is still required. Gemini is a tool for digital communication — not for print workflows.
Gemini vs. the competition: Canva, ChatGPT and Ideogram
Gemini is not the only tool for AI infographics. Depending on the situation, alternatives may make more sense. An honest comparison of the most relevant tools — without marketing speak.
| Google Gemini | Canva AI | ChatGPT (DALL-E) | Ideogram V3 | |
|---|---|---|---|---|
| Text in images | Excellent | Good (Templates) | Medium | Excellent |
| Free entry | – | Limited | Limited | |
| Grounding (real-time data) | – | – | – | |
| Flexibility via prompt | High | Low (Templates) | High | High |
| Price from (CHF/month) | Free / ~22 | ~15 | ~20 | ~14 |
| Export formats | PNG/JPG | PNG/JPG/PDF/SVG | PNG/JPG | PNG/JPG |
Prices rounded in CHF. As of April 2026. All tools continue to evolve.
No tool is objectively the best — there is only the right one for a specific use case. Canva is the right choice when brand consistency via templates matters more than flexibility. ChatGPT (DALL-E) is an option when Gemini isn't in your existing tool stack. Ideogram V3 beats Gemini when maximum text accuracy is the decisive criterion — for posters, advertising materials, or graphics with complex text elements. For digital infographics with current data, Gemini currently has the strongest cost-benefit advantage.
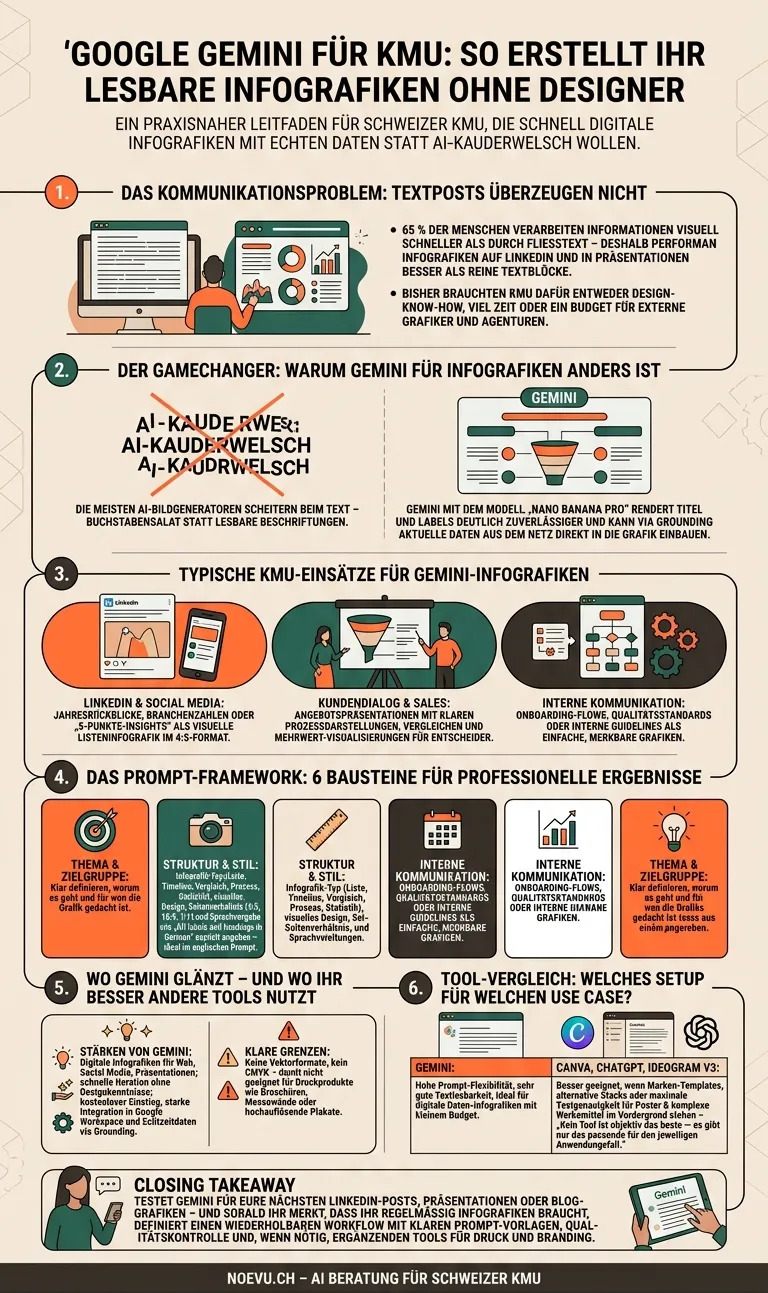
A real Gemini infographic — as an example
Here is a concrete example: we fed Gemini the brief for this very article — no design step, no template. The result is below at full height. Two small weaknesses are visible (see caption) — typical for AI images, easy to fix in a second iteration.
Conclusion: Gemini as an entry point to AI infographics
Google Gemini is a genuine step forward for digital infographics — not because it's perfect, but because it overcomes the biggest hurdle to date: text stays readable, access is free, and integration with Google Workspace reduces tool switching to a minimum. For SMEs wanting to improve their digital communication without significant design effort, this is a realistic starting point.
The limits are clear: print products, professional branding, and pixel-accurate design control are not Gemini's domain. Professional design work remains irreplaceable there. But for LinkedIn posts, presentations, internal training, or blog visualizations, Gemini is today a sensible and cost-effective option — no design degree, no agency brief, no waiting time.
Those who want to go beyond manual one-off use — for example automating infographic production for SEO content at scale — need a different approach: a structured workflow combining prompt templates, API access, and automated quality control. A different task, but a solvable one.

For SEO content, social media, or landing pages: as an automated workflow, infographics can be produced in large volumes — without manual effort for each individual image.
Frequently Asked Questions
Is Google Gemini free for infographics?
Yes, access to Gemini and its image generation feature is available with a free Google account. For advanced features and higher generation limits, Gemini Advanced is available at approximately CHF 22/month. For initial testing and occasional infographics, the free tier is fully sufficient.
Can Gemini embed text correctly in infographics?
Yes — that's its main advantage over Midjourney, DALL-E, or Adobe Firefly. The Nano Banana Pro model renders titles, labels, and short texts in generated images with significantly higher reliability. For complex text or multilingual labels, an iterative process with several generation attempts is still recommended.
What file formats can I export from Gemini?
Gemini exports images as PNG or JPEG — raster formats only. Vector formats (SVG, EPS, PDF) are not supported. This means Gemini infographics are suitable for digital channels (web, social media, presentations) but not for print products requiring high resolution or scalability.
Is Gemini better than Canva for infographics?
It depends on the use case. Canva is better when you need an existing brand kit, templates, and drag-and-drop control — and are willing to pay for it. Gemini is better when you want to experiment flexibly with text prompts, without design skills, and want to embed real-time data via grounding. The two tools are not mutually exclusive.
How long should an infographic prompt be?
A good infographic prompt for Gemini is 50–150 words and includes topic, target audience, infographic type, visual style, aspect ratio, and the desired language for text elements. Prompts that are too short produce generic results; prompts that are too long are often misinterpreted. Write in English — even if the text in the image should appear in another language.